Turn Your Sales Data Into Actionable Business Intelligence
Your business data is scattered across dozens of platforms — and it's costing you millions in blind spots. Grader.io/bi pulls every data point from every system into a single intelligence layer that doesn't just visualize — it thinks. AI-driven deductions surface the insights your competitors will never see.
Fragmented Data Is Costing You Millions in Blind Spots
When your ERP, CRM, payment processing, and business platforms exist in silos, you're operating blind. The cost isn't just inefficiency — it's millions in opportunities you never knew existed.
Teams spend 20+ hours weekly pulling data from multiple systems, creating basic reports instead of analyzing insights and driving strategy.
You're making million-dollar decisions with 40% visibility. Critical signals are trapped in disconnected platforms, and by the time you see the pattern, the opportunity is gone.
Revenue leaks, churn signals, and upsell opportunities are hiding in your data right now. You just can't see them. Your competitors using AI-driven intelligence layers already spotted them.
When five platforms show five different revenue numbers, which one is true? Conflicting data destroys confidence, creates political battles, and paralyzes strategic decisions.
The Intelligence Gap Crisis
Organizations without unified intelligence lose an average of $8.7M annually in blind spots and missed deductions. The companies winning in your market aren't smarter — they just see more.
Industry research: Industry research: Companies with AI-driven intelligence layers achieve 27% faster revenue growth and 18% higher profit margins than those relying on disconnected reporting.
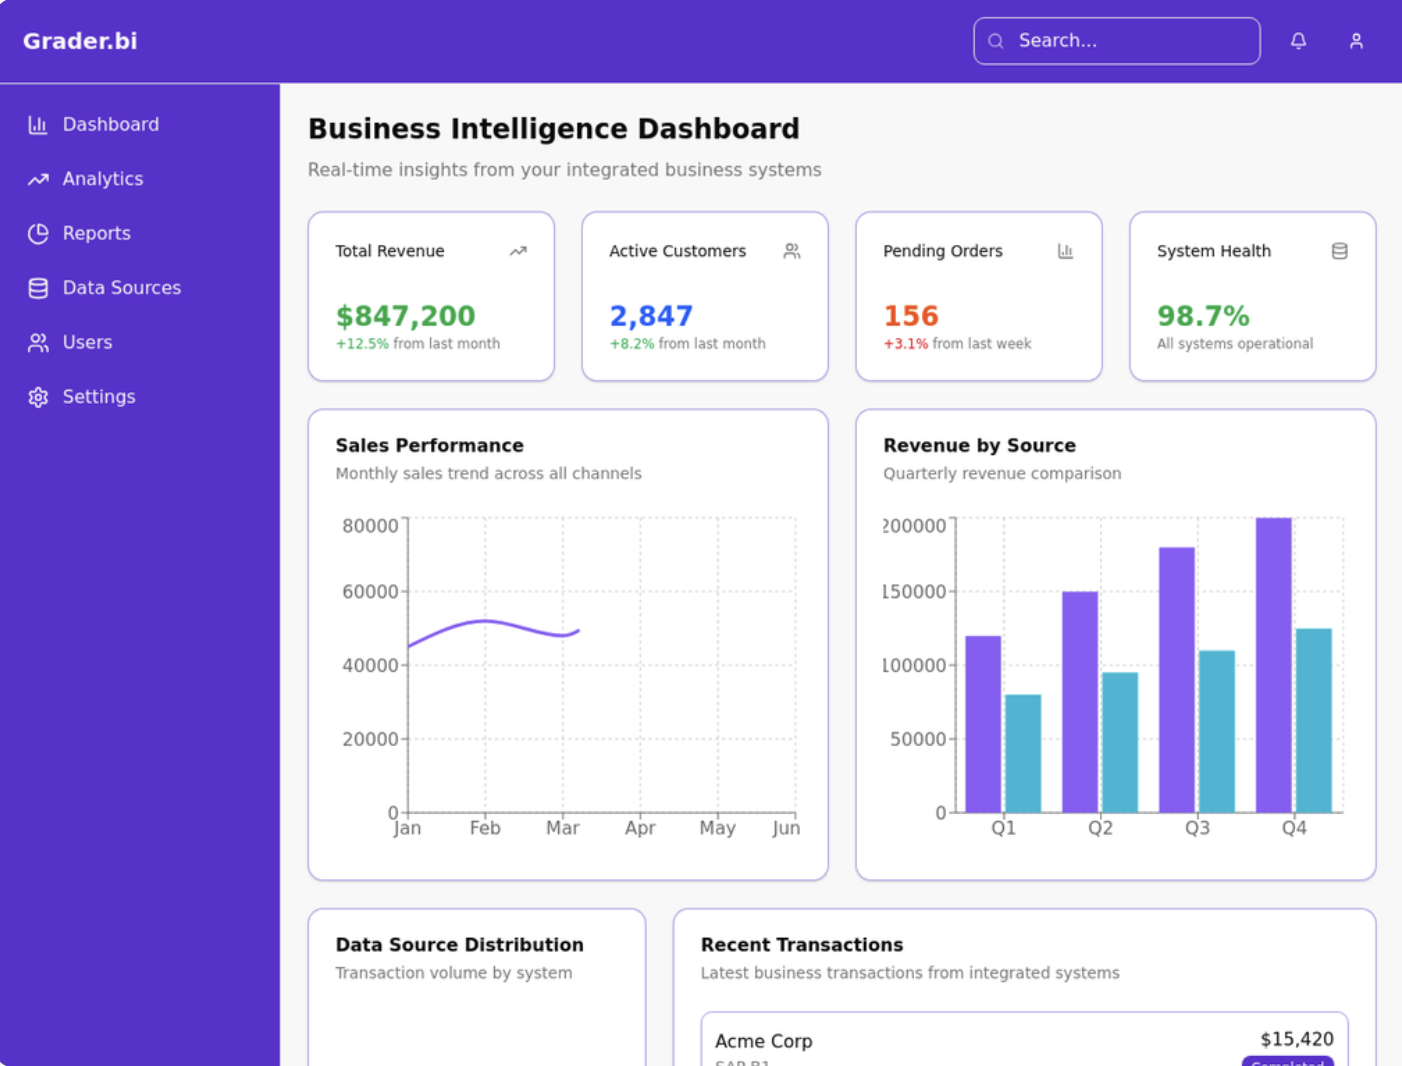
See the Intelligence Layer in Action
Watch how the intelligence layer unifies every data source and makes AI-driven deductions in real-time. This isn't visualization — this is your business thinking for the first time.
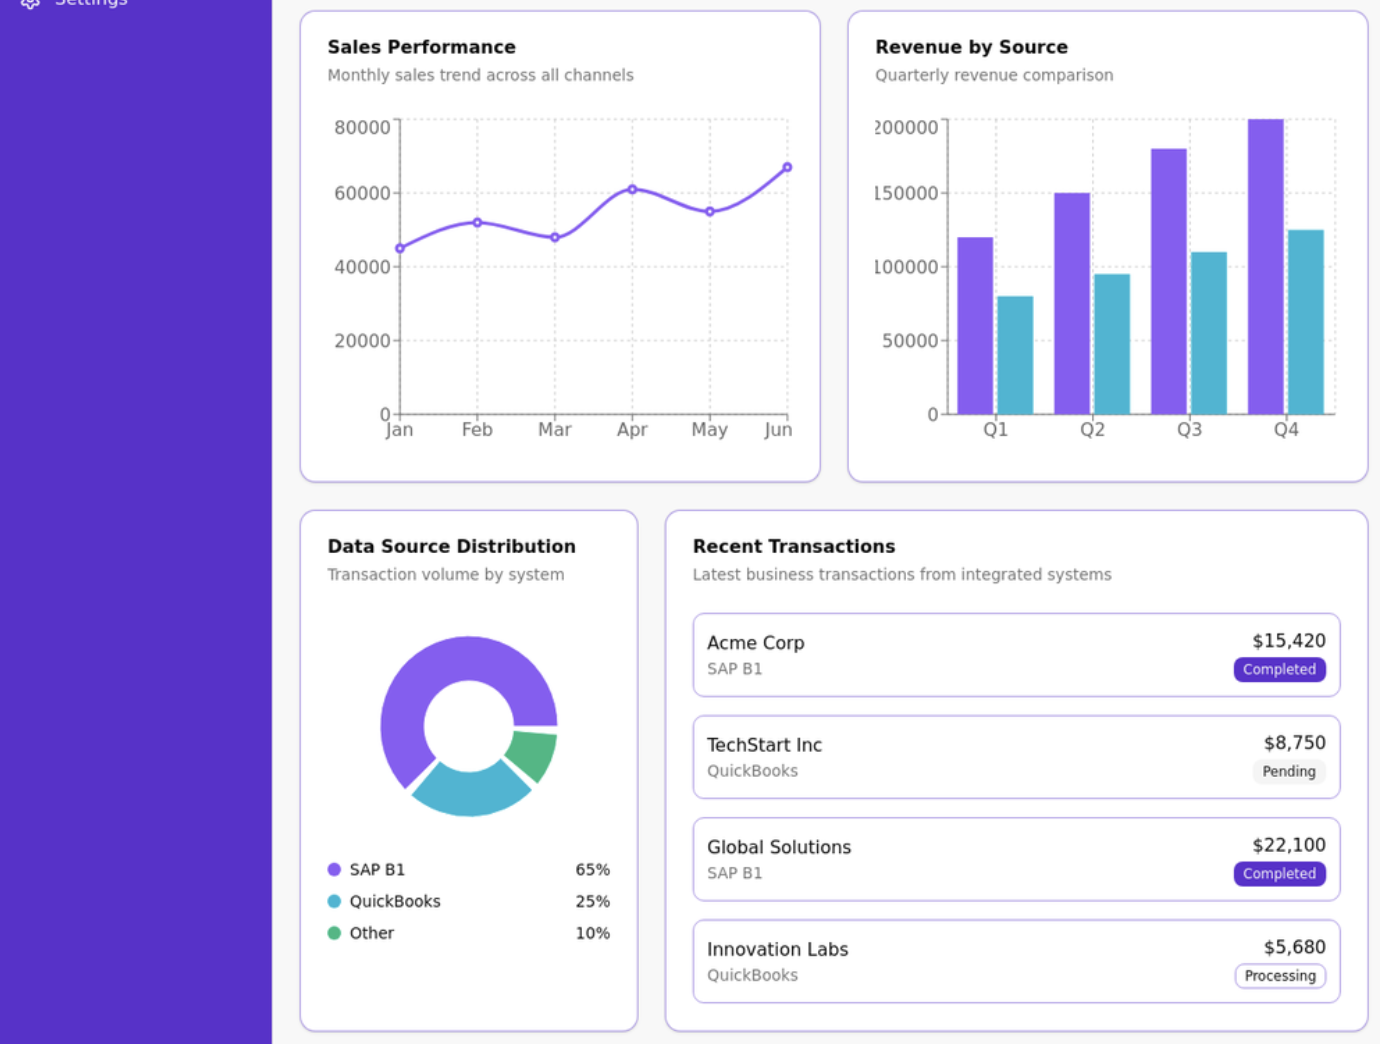
Connect any data source — one unified view across all your tools
Why Intelligence Layers Change Everything
Stop building reports. Start surfacing truth. Grader.io/bi's intelligence layer unifies every data source and makes AI-driven deductions that reveal what spreadsheets will never show.
Surface What Competitors Can't See
AI analyzes millions of data points per second across all platforms, surfacing patterns, anomalies, and opportunities invisible to human analysts. Deductions no spreadsheet can make.
87% faster insight discoveryAI Predicts Before Problems Hit
The intelligence layer doesn't wait for you to ask questions. It actively monitors every metric, flags what matters, and surfaces churn signals, revenue risks, and cash flow gaps weeks before impact.
3-6 weeks early warningEliminate Blind Spots Forever
Every platform, every data source, unified into a single source of truth. No more wondering which number is right. No more reconciling conflicting reports. Just unified intelligence, always.
15+ hours saved weeklyEvery Decision Backed by Unified Truth
When your intelligence layer unifies every data point in real-time, politics disappear. Strategic decisions become laser-focused because everyone operates from the same truth.
94% forecast accuracyMeasurable Business Impact
Companies using Grader.io/bi don't just see their data better — they operate in a different reality. Here's how unified intelligence translates to market dominance.
Revenue Growth
AI-driven deductions surface upsell signals, churn risks, and market opportunities your competitors will never see.
15-25% revenue increaseOperational Efficiency
The intelligence layer flags bottlenecks, waste, and process failures automatically. No more digging through reports to find what's broken.
30% efficiency gainsTeam Alignment
Everyone operates from the same intelligence layer. No conflicting data. No political battles. Just unified truth driving unified action.
90% goal alignmentCompetitive Edge
While competitors wait for quarterly reports, your intelligence layer surfaces market shifts in real-time. React before they even notice.
3x faster response timeThe Intelligence Difference
❌ Without Unified Intelligence
- • Hours building manual reports
- • Critical deductions trapped in silos
- • Delayed decisions, missed opportunities
- • Conflicting data, political battles
- • Reactive firefighting, blind spots everywhere
✅ With Grader.io/bi Intelligence Layer
- • AI surfaces insights automatically
- • Patterns emerge before humans spot them
- • Confident decisions backed by unified truth
- • Everyone operates from same intelligence
- • Proactive deductions prevent crises
The Intelligence Layer That Thinks
This isn't another BI tool. Grader.io/bi is a paradigm shift — an AI-powered intelligence layer that unifies all your data sources and makes deductions humans can't. Stop visualizing. Start knowing.
Every data source, every platform, every metric flows into a single source of truth. No more guessing which number is right. The intelligence layer unifies everything and makes AI-driven deductions in real-time.
Bank-level encryption and secure data connections protect your sensitive financial and customer information with SOC 2 compliance standards.
Our intelligence layer doesn't just visualize — it thinks. AI surfaces patterns, anomalies, and opportunities that no human analyst would catch. Deductions no spreadsheet can make.
These aren't static charts. Your intelligence layer actively monitors every metric, flags what matters, and surfaces insights before problems become crises. It knows what you need to see.
Millions of data points analyzed every second. AI-driven deductions identify revenue leaks, customer signals, and market shifts invisible to traditional analytics. Your competitors are flying blind.
When everyone operates from the same intelligence layer, politics disappear. No more conflicting reports. No more arguing about which data is right. Just truth, unified and actionable.
Ready to Eliminate Your Blind Spots?
Our intelligence architects will map your entire data ecosystem and design an AI-powered intelligence layer that surfaces what humans miss. Every decision backed by unified truth.
Trusted by Enterprise Leaders
Fortune 500 companies and fast-growing enterprises rely on Grader.io/bi's intelligence layer to surface AI-driven deductions that unlock revenue, eliminate blind spots, and create competitive advantages traditional analytics will never match.
"Grader.io/bi delivered immediate business impact. Our executives now have unified sales visibility across all platforms, resulting in 47% better forecast accuracy and $2.3M additional revenue in the first quarter alone. The strategic insights exceeded expectations."
"The unified dashboard eliminated 85% of our manual reporting work, saving 120 hours monthly across our analytics team. We achieved actionable insights in weeks and redirected resources to strategic revenue optimization initiatives."
"Grader.io/bi's real-time sales analytics and seamless platform integration exceeded our expectations. The unified reporting supports our global operations with instant insights, enabling data-driven decision making across all business units."
Stop Operating Blind
The companies dominating your market aren't smarter — they just have better intelligence. Join the leaders who eliminated blind spots and unlocked millions through AI-driven deductions.
From Data Chaos to Unified Intelligence
Our team builds the intelligence layer that transforms scattered platforms into a single source of truth. AI-driven deductions start surfacing insights on day one.
Map Your Data Ecosystem
Our intelligence architects analyze every platform, every data source, every blind spot in your current stack. We design the intelligence layer that unifies everything.
Build Your Intelligence Layer
We securely connect every system — ERP, CRM, payment processing, every business platform — into a unified intelligence layer. AI-driven deductions begin immediately.
Deploy Intelligent Dashboards
These aren't static reports. Your intelligence layer builds dashboards that think — actively monitoring, flagging, and surfacing what matters before you ask.
Surface Insights Continuously
The intelligence layer runs 24/7, making deductions, flagging anomalies, and surfacing opportunities. Your competitive advantage compounds daily.
Ongoing Business Intelligence Success
Implementation Promise
Start seeing actionable insights from your sales data within 15 minutes of setup. Our platform is designed for immediate value with enterprise-grade reliability.
✓ 15-minute setup to first insights
Business Intelligence, Designed Around You.
Every engagement is a custom build. Choose the tier that matches your scale and intelligence requirements.
Starter
For growing teams that need centralized visibility.
30-day implementation
Growth
For scaling organizations requiring multi-department intelligence.
60-day implementation
Enterprise
For companies requiring full operational intelligence infrastructure.
Custom scope & timeline
All tiers include strategic consultation, custom development, and implementation support. Enterprise scope available on request.
Ready to Transform Your Business Intelligence?
Stop making million-dollar decisions with incomplete data. Join the companies already using Grader.io/bi's intelligence layer to surface AI-driven deductions that unlock hidden revenue and eliminate blind spots your competitors can't see.
Questions? Our BI experts are standing by to help. Call us at (856) 567-5652 or email info@grader.io